


Study selection
The PRISMA flowchart for study selection is presented in Fig. 1. A total of 3,334 studies were initially identified through electronic database searches and thirty-five studies through grey literature searches. After excluding duplicates, a total of 2,415 titles and abstracts were screened. After screening of titles and abstracts, a total of 399 potentially relevant articles were retained for full-text screening. After full-text assessment, 18 eligible studies were eligible for the systematic review and meta-analyses (Table S1, Supplementary material 4).
Study characteristics
Characteristics of the 18 included studies are summarised in Table 1. The studies were published between 2003 and 2024 and were conducted across 13 countries including United States (n = 8) [29, 35,36,37,38,39,40,41], European countries including United Kingdom (n = 6) [42,43,44,45,46,47], China (n = 2) [27, 48], Brazil (n = 1) [26], and India (n = 1) [28]. Fourteen studies were conducted in high-income countries [29, 35,36,37,38,39,40,41,42,43,44,45,46,47]three in upper-middle-income countries [26, 27, 48]and one in lower-middle-income country [28]. Eight studies were conducted in hospitals [27,28,29, 36, 37, 39, 42, 48] and ten in primary care services including GP or outpatient clinics [26, 35, 38, 40, 41, 43,44,45,46,47].

The PRISMA flow diagram of study selection. ACEi: Angiotensin-converting enzyme inhibitor, ARB: Angiotensin receptor blockers, MACE: Major adverse cardiovascular events
Overall, 438,285 (28,970 from primary care services and 409,315 from hospitals) patients were enrolled with a pooled mean age (pooled SD) of 61.72 (12.8) years and 72% of the participants were male. Eleven studies were cRCTs [26, 27, 29, 36,37,38, 42, 43, 45, 46, 48]six were RCTs [35, 39,40,41, 44, 47] and one was step-wedged cRCT [28]. Sixteen studies reported outcomes at individual patient level26–29,35,36,38–42,44−48 and two studies reported the outcomes at cluster level [37, 43].
The median number of participating primary care services was 42 (IQR: 30, 124). Primary care-based QI interventions included all adult patients, CVD risk factors, heart failure, Atherosclerotic Vascular Disease and peripheral arterial disease. The median number of participating tertiary care hospitals was 47.5 (IQR: 31.5, 87.5). Hospital-based QI interventions, in addition to primary care-based population, targeted a wide variety of populations with CVD. The studies focused on improving adherence to evidence-based guidelines for secondary management of CVD, prescription of guideline-recommended CVD medications, clinical decision making, risk factor management education and CVD-related performance measures.
QI interventions
All 18 studies implemented complex, multicomponent QI interventions and used a combination of strategies to improve CVD management (Table S2, Supplementary material 4). The median duration of the intervention was 12 months (IQR: 10.5, 18.7). The most commonly used QI strategy was feedback reports provided to participating healthcare providers, which were used in 83% (n = 15) of the studies [26,27,28,29, 35,36,37,38, 41, 43,44,45,46,47,48]. Among the 15 studies using feedback reports; seven studies compared their performance with other sites in the intervention arm or against regional and national level data [27, 28, 35, 37, 44, 46, 47]. Another commonly implemented QI strategy was the use of different decision support tools by the healthcare facilities including care reminder, treatment protocols, checklists, clinical guidelines and recommendations, pocket cards, standardised admission, and discharge orders. (87%, n = 13) [26,27,28, 35,36,37,38,39,40,41, 44, 47, 48].
Additional QI strategies included the establishment of QI teams in 50% (n = 9) of the studies [27,28,29, 36, 38, 39, 41, 42, 48]. 39% (n = 7) of the studies used practice support or facilitation [27, 36, 38, 43,44,45,46]QI workshops, seminars or webinars for healthcare providers [26, 27, 29, 36, 38, 42, 48], use of physicians as local champions or quality coordinators [26, 27, 36,37,38, 42, 48]and digital platforms such as online portals and online text messaging platforms [27, 38, 40,41,42, 44, 48]. Site visit was used in 28% (n = 5) [26, 29, 43, 45, 47] of the studies and Plan-Do-Study-Act cycles were used by 11% (n = 2) of the included studies [28, 42]. Two studies (15%) used regular team meetings [28, 42]. One study provided CHW training and support [38]while another study provided access to clinical pharmacist throughout the intervention period [39]. Additionally, one study awarded certificates to GPs for six hours of accredited training [43] and another provided certificates to participating sites [46] for their participation in the QI intervention. To ensure effective implementation of interventions, nine studies (50%) provided training for team members prior to the study [28, 29, 36, 40,41,42,43, 45, 48].
QI strategies varied by cardiovascular disease subtype. Studies targeting CHD reported the broadest range of interventions, including frequent use of decision support tools (6 studies), feedback reports (6), patient education materials (5), and local champions (3). Studies focusing on CVD also showed wide strategy use, particularly practice facilitation (5), decision support tools (6), and feedback reports (6). In contrast, studies focusing on heart failure applied a narrower range of strategies, most commonly feedback reports (3), site visits (2), staff education (2), and QI teams (2). (Table S4, Supplementary Material 4) Across settings, some QI strategies were commonly used in both primary care and hospitals, such as decision support tools (6 vs. 7 studies), feedback reports (8 vs. 7), and patient education materials (4 each). However, strategies like practice facilitation, site visits, and staff education materials were more frequent in primary care, whereas QI teams, PDSA cycles, and local champions were more prominent in hospital-based interventions. (Table S5, Supplementary Material 4)
Risk of bias assessment
Figures 2 and 3 summarises the risk of bias assessment for included studies [49]. Five out of 18 studies (28%) had an overall risk of bias judged as high [35, 38, 44, 46, 47]. Seven studies (39%) were at low risk [26,27,28, 36, 39, 45, 48] and another six (33%) were judged as unclear risk of bias [29, 37, 40,41,42,43]. Random sequence generation and allocation concealment were described adequately in 17 (94%) and 14 (78%) studies, respectively. Eleven studies (61%) were at low risk of attrition bias [26,27,28, 36,37,38,39,40, 43, 45, 48]. Thirteen studies (72%) were at low risk of selective reporting as they reported all expected outcomes in accordance with the protocol or trial registration [26,27,28,29, 35, 36, 38,39,40,41,42, 45, 46, 48]. All risk of bias data is provided in Table S3, Supplementary Material 4.
Publication bias
No significant publication bias was found from assessing funnel plots and Egger’s regression test. (Supplementary material 5)

Risk of bias summary: risk of bias judgement on each domain by study

Risk of bias graph: judgement of risk of bias domains presented as percentages
Prescription of guideline-recommended medications
Nine studies (50%) measured the proportion of patients prescribed antiplatelet therapy and seven studies were included in the meta-analyses. The pooled analyses showed that the QI intervention did not significantly improve the prescription of antiplatelet therapies compared to usual care (OR: 1.20, [95% CI: 0.92, 1.58]) with substantial heterogeneity (Tau2 = 0.08, I2 = 72.90%, p = 0.00; Fig. 4.1 within composite Fig. 4) [26, 28, 40, 42, 44, 46, 47]. Three of the included studies had high risk of bias and a sensitivity analyses was performed by excluding these studies to assess the robustness of the findings [40, 44, 46, 47]. The sensitivity analyses of the remaining four studies also showed non-significant improvement in the prescription of antiplatelet therapy (OR: 1.31, [95% CI: 0.75, 2.29]) with substantial heterogeneity (Tau2 = 0.226, I2 = 74.64%, P = 0.008; Fig. 5.1 within composite Fig. 5) [26, 28, 40, 42]. An exploratory leave-one-out analysis was also conducted, the results of which indicated that the inclusion of individual studies did not significantly influence the overall estimate. Full results of this analysis are presented in Supplementary Material 5 for transparency.
Two studies were excluded from meta-analyses as they analysed cluster-level data. Frijling et al. measured the prescription of aspirin and sub-lingual nitrate and found similar results to the meta-analyses where the effect of the QI intervention on the outcome was not significant (OR:1.44, [95% CI: 0.86, 2.41];) [43]. Williams et al. measured the difference between the mean change in prescription adherence score between the intervention and usual care groups was not significant (2.9% vs. 4.2%, p = 0.255) [37].
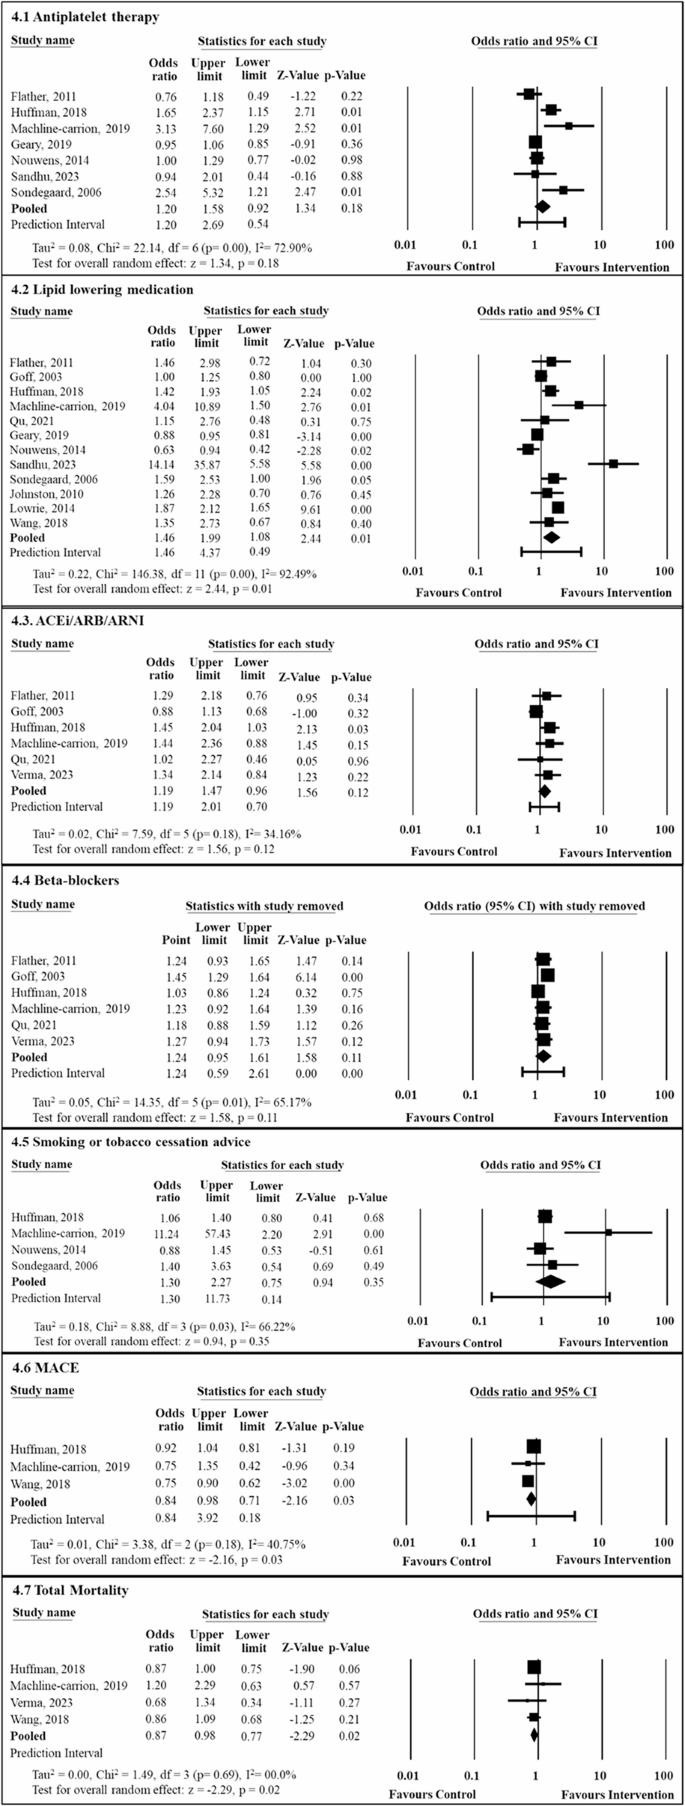
Meta-analyses of the effect of quality improvement intervention on medication prescription, smoking cessation advice and clinical events. CI: Confidence Interval, ACEi: Angiotensin-converting enzyme inhibitor, ARB: Angiotensin receptor blockers, ARNI: Angiotensin receptor/neprilysin inhibitor, MACE: Major adverse cardiovascular events
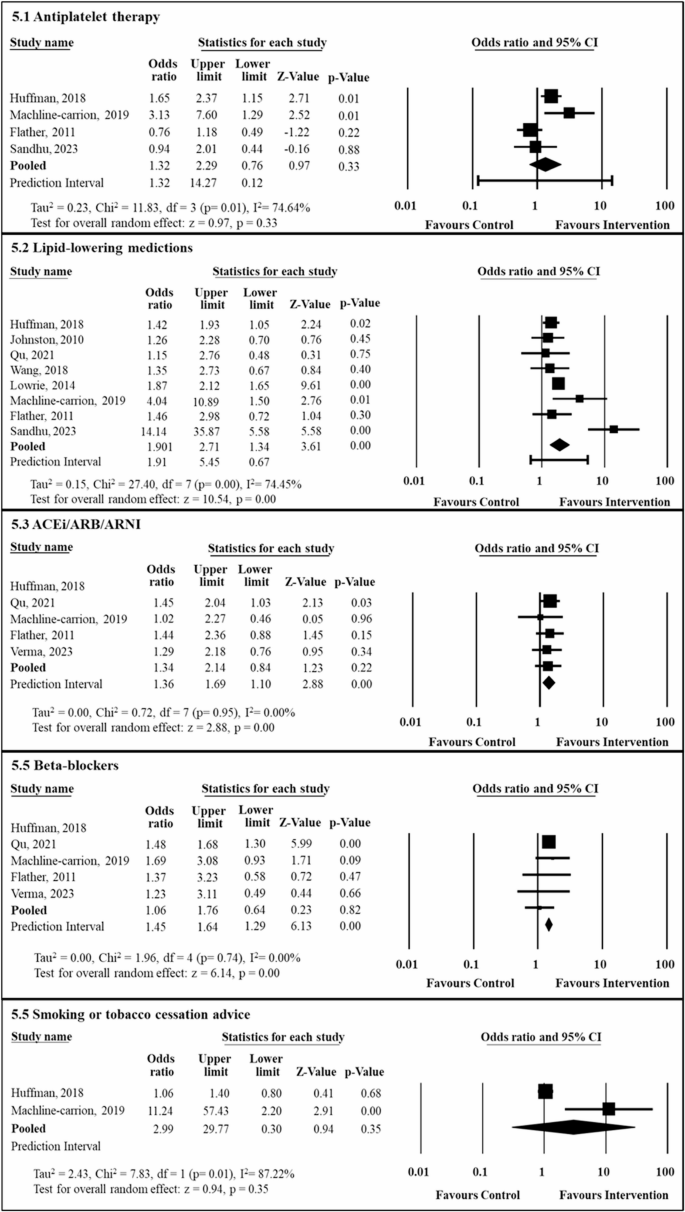
Sensitivity analyses of the effect of quality improvement intervention on medication prescription and smoking cessation advice excluding high risk of bias studies. CI: Confidence Interval, ACEi: Angiotensin-converting enzyme inhibitor, ARB: Angiotensin receptor blockers, ARNI: Angiotensin receptor/neprilysin inhibitor
Thirteen studies (72%) reported the proportion of patients prescribed lipid-lowering medications and 12 studies were included in the meta-analyses. The pooled analyses showed that the QI intervention improved the prescription of lipid-lowering medications compared to usual care (OR: 1.46, [95% CI: 1.08, 1.99]) with substantial heterogeneity (Tau2 = 0.22, I2= 92.49%, p = 0.00; Fig. 4.2 within composite Fig. 4) [26,27,28, 35, 36, 40, 42, 44,45,46,47,48]. Four studies had high risk of bias [35, 44, 46, 47] and therefore the sensitivity analyses was performed on the remaining eight studies. The sensitivity analyses also showed significant improvement in the prescription of lipid-lowering medications (OR: 1.63, [95% CI: 1.34, 2.00]) with substantial heterogeneity (Tau2 = 0.152, I2 = 74.49%, P = 0.000; Fig. 5.2 within composite Fig. 5) [26,27,28, 36, 40, 42, 45, 48]. Exploratory sensitivity analyses were conducted by removing two studies with extreme effect sizes and wide confidence intervals, results of which are presented in Supplementary Material 5 for transparency. Results found by Williams et al. were not included in the meta-analyses as it analysed cluster-level data. Williams et al. measured the difference between the mean change in prescription adherence score between the intervention and usual care group and found that it was statistically significant (13.1% vs. 15.7%; P = 0.017) [37].
Seven studies (39%) reported the prescription of ACEi/ARB/ARNI, and six of them were included in the meta-analyses. The pooled analyses showed that QI intervention did not improve the prescription of ACEi/ARB/ARNI compared to usual care (OR: 1.19, [95% CI: 0.96, 1.47]) with moderate statistical heterogeneity (Tau2 = 0.024, I2= 34.16%, p = 0.180; Fig. 4.3 within composite Fig. 4) [26, 28, 35, 41, 42, 48]. Additionally, One study had high risk of bias [35]therefore the sensitivity analyses was performed on the remaining five studies. However, the sensitivity analyses showed significant improvement in the prescription (OR: 1.90, [95% CI: 1.34, 2.71]) with no heterogeneity (Tau2 = 0.00, I2 = 0.00%, P = 0.948; Fig. 5.3 within composite Fig. 5) [26, 28, 41, 42, 48]. An exploratory leave-one-out analysis demonstrated a significant improvement in the prescription of ACEi/ARB/ARNI, with the full results presented in Supplementary Material 5 for transparency. Williams et al. measured the difference between the mean change in prescription adherence score between the intervention and usual care groups at cluster level, therefore the results were excluded from the meta-analyses. However, the study also reported a greater improvement in the intervention group compared to the control (13.1% versus 6.4%; P < 0.001) [27].
Seven studies (39%) reported the prescription of beta-blockers, and five of them were included in the meta-analyses The pooled analyses showed that QI intervention did not improve the prescription of beta-blockers compared to usual care (OR: 1.24, [95% CI:0.95, 1.61]) with moderate statistical heterogeneity (Tau2 = 0.054, I2= 65.17%, p = 0.014; Fig. 4.4 within composite Fig. 4) [26, 28, 35, 41, 42, 48]. One study had high risk of bias [35]therefore the sensitivity analyses was performed on the remaining five studies. Conversely, the sensitivity analyses showed significant improvement in the prescription of beta-blockers (OR: 1.45, [95% CI: 1.29, 1.63]) with no heterogeneity (Tau2 = 0.00, I2 = 0.00%, P = 0.743; Fig. 5.4 within composite Fig. 5) [26, 28, 41, 42, 48]. An exploratory leave-one-out sensitivity analysis revealed mixed results, which are presented in Supplementary Material 5 for full transparency. Williams et al. measured the difference between the mean change in prescription adherence score between the intervention and usual care groups at cluster level and could not be included in the meta-analyses. However, the study found significant improvement (12.2% versus 9.7%; P = 0.032) [37].
Risk factor management
Four studies (22%) reported adequate control of BP. Meta-analyses was not performed for this outcome due to variations in BP control targets and reporting methods across studies. One study used a target for adequate BP control as SBP < 140 [46], while another presented results as least squares mean (95% CI). The remaining two studies used a combined target of SBP < 140 and DBP < 90 [26, 36]. Johnston et al. reported significant improvement in the BP control (OR: 1.27, [95% CI: 1.02, 1.57]) in intervention hospitals compared to control [36]. One study, however, showed no significant improvement in achieving adequate BP control in both groups (OR: 1.37, [95% CI: 0.87, 2.18]) [26]. Another study found the both intervention and usual care group showed reduction in the proportion of patient reaching the adequate blood pressure target, but the reduction was more in the usual care group (10.7% vs. 11.9%); resulting in a 1.2% between-group change, however, the change was not significant [46]. Finally, a study found no significant difference in SBP reduction between the two groups (P = 0.45), but DBP reduction was significantly greater in one group (P = 0.02).
Five studies (28%) reported the proportion of patients with adequate control of total or LDL-C. Adequate cholesterol control was measured differently in these studies, hence a meta-analyses was not performed for this outcome. Lowrie et al. measured the proportion of patients achieving a total cholesterol target of < 5 mmol/l and found that patients in the intervention arm were more likely to achieve the cholesterol targets compared to the usual care (OR:1.81, [95% CI: 1.63, 2.01]) [45]. Two studies measured the proportion of patients with an LDL-C level < 100 mg/dl [26, 40]. One study found a higher proportion of patients in the intervention group achieved the LDL-C target compared to the usual care group (76.4% vs. 71.6%). However, the improvement was not statistically significant (OR: 1.23, [95% CI: 0.67, 2.26]) [26]. The other study found no significant difference between the intervention and usual care groups (OR: 5.02, [95% CI: 0.44, 18.96] [40]. A third study measured the proportion of patients with an LDL-C level < 70 mg/dl and also found no significant difference between the intervention and usual care groups for LDL-C control (OR: 14.44, [95% CI: 0.46, 2.67] [39]. Lastly, one study measured the percentage of patients with LDL-C level < 2.5 mmol/l and found a slight reduction in the proportion of patient achieving cholesterol target in intervention compared to usual care group (1.1% vs. 1.0%); resulting in a 2.1% between-group change, however the change was not significant [46].
Four studies (22%) reported the proportion of patients receiving cessation counselling and all were included in the meta-analyses. The pooled analyses showed that there was no difference in the proportion of cessation support or counselling received between intervention and usual care groups (OR: 1.30, [95% CI: 0.75, 2.27]) and found substantial heterogeneity between studies (Tau2 = 0.18, I2= 66.22%, p = 0.03; Fig. 4.5 within composite Fig. 4) [26, 28, 46, 47]. A sensitivity analyses was performed by removing two studies with high risk of bias [46, 47]. The sensitivity analyses showed similar results (OR: 2.93, [95% CI: 0.30, 29.77]) with substantial heterogeneity (Tau2 = 2.43, I2 = 87.22%, P = 0.00; Fig. 5.5 within composite Fig. 5) [26, 28]. An exploratory leave-one-out sensitivity analysis showed inconsistent findings and is presented in Supplementary Material 5 for transparency.
Clinical events
Three studies (17%) reported MACE and all three studies were included in the meta-analyses. The pooled analyses showed that QI intervention led to significant reduction in MACE compared to usual care (OR: 0.84, [95% CI: 0.71, 0.98]) with moderate heterogeneity (Tau2 = 0.008, I2 = 40.76%, p = 0.18; Fig. 4.6) [26,27,28].
Five studies (28%) reported total mortality and four were included in the meta-analyses. The pooled analyses showed a significant reduction in total mortality associated with the intervention compared to usual care (OR: 0.87, [95% CI: 0.77, 0.98]) with no heterogeneity (Tau2 = 0.00, I2 = 00.00%, p = 0.69) (Fig. 4.7) [26,27,28, 41]. Devore et al. reported the Total mortality using Kaplar-meoer survival rates rather than event counts or OR, therefore was excluded from the meta-analyses. The study found a similar total mortality rate between the intervention and usual care groups, with an adjusted hazard ratio (HR) of 0.93 (95% CI: 0.81–1.06), indicating no significant difference between the groups [29].
Subgroup analyses based on healthcare settings
Subgroup analyses comparing outcomes across clinical settings (primary care services vs. hospitals) demonstrated variations in the effectiveness of the intervention (Table 2). While most outcomes showed no significant differences, between settings, significant differences were observed for lipid-lowering medications (p = 0.00), ACEi/ARB/ARNI prescriptions (p = 0.03), beta-blocker prescriptions (p = 0.00), and total mortality (p = 0.02). Notably, QI interventions were more effective in improving ACEi/ARB/ARNI and beta-blockers prescriptions [28, 42, 48] and reducing total mortality [27, 28] in hospital settings, while improvements in lipid-lowering medications were evident across both primary care [26, 35, 40, 44,45,46,47] and hospital settings [27, 28, 36, 42, 48].
Subgroup analyses based on follow-up time-point
Sub-group analyses were conducted to compare outcomes based on follow-up periods (< 12 months, ≥ 12 months, and not reported) (Table 3). For most outcomes, there were no statistically significant differences between the follow-up groups. However, significant differences were noted for lipid-lowering medications (p = 0.06), ACEi/ARB/ARNI prescriptions (p = 0.02), beta-blockers prescriptions (p < 0.001), MACE (p < 0.001), and total mortality (p = 0.02) in studies with shorter (< 12 months) and longer (≥ 12 months) follow up periods. Specifically, QI interventions were more effective in improving ACEi/ARB/ARNI and beta-blockers prescriptions and reducing total mortality in studies with shorter follow-up periods (< 12 months), whereas improvements in MACE were observed in studies with longer follow-up periods (≥ 12 months) (Table 3).
link
More Stories
UniHealth Hospitals Limited Announces the Commissioning of its Advanced Tertiary Care, Multi-Specialty Hospital in Navi Mumbai
Predictors of opportunistic infections among people living with HIV: a prospective cohort study from a tertiary care setting in India
The impact of DRG payment reform on inpatient costs for different surgery types: an empirical analysis based on Chinese tertiary hospitals